OpenTelemetry Streaming
Important
OpenTelemetry streaming is only available as part of the Enterprise tier. Please refer to the pricing page for more information. Some of this functionality can also be achieved by using Operational Webhooks.
Svix offers OpenTelemetry streaming as a way to stream webhook delivery traces to observability platforms that support OpenTelemetry such as Datadog, Grafana, Coralogix, and most other observability platforms.
What does Svix send
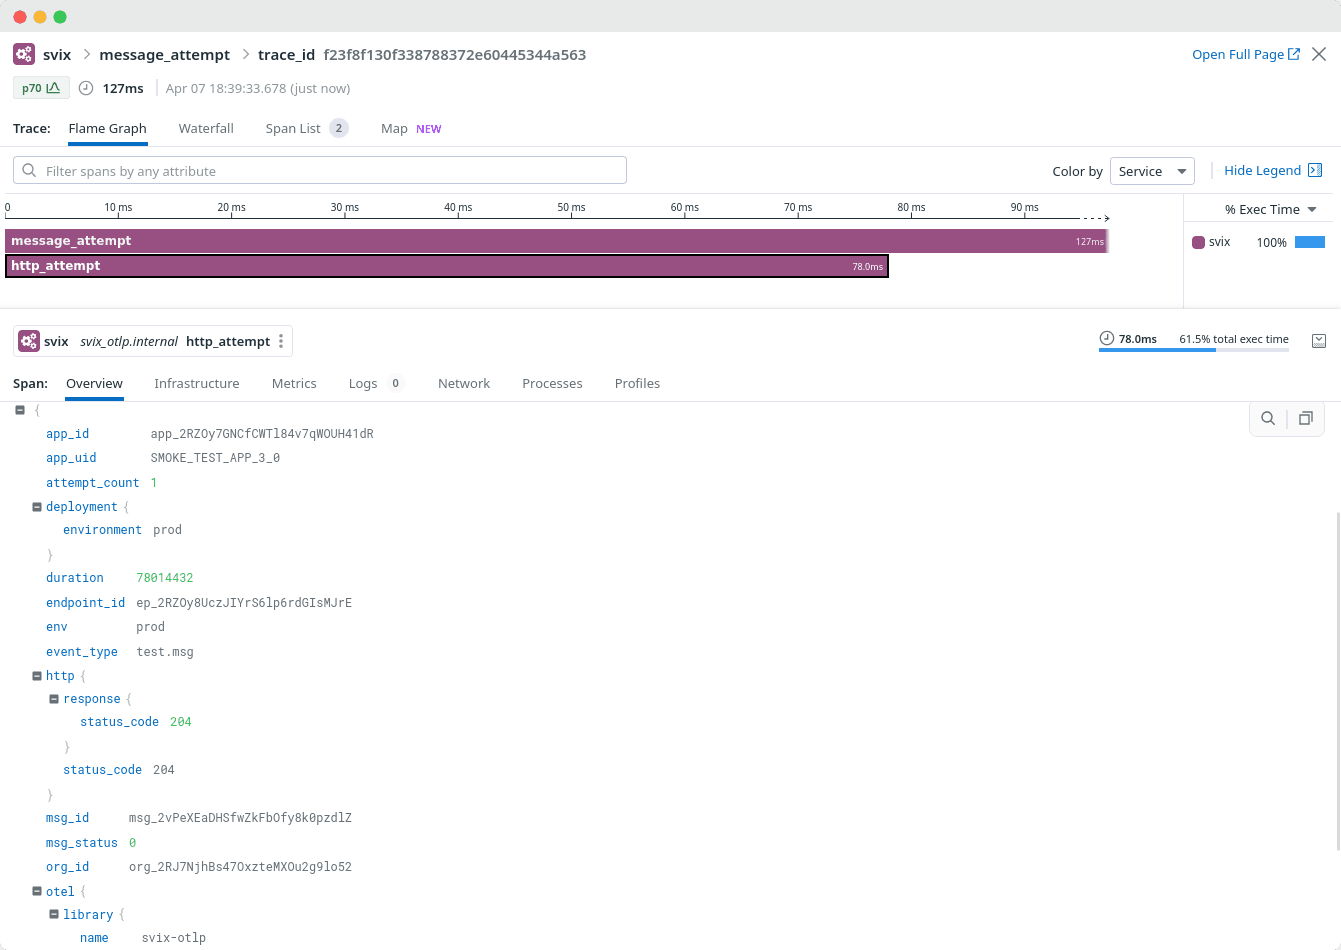
Svix sends OpenTelemetry traces as two spans: the outer span message_attempt and the inner span http_attempt.
Both spans include the following attributes:
start: DateTime<Utc>  // Included as the span start time (not a field)
end: DateTime<Utc>    // Included as the span end time (not a field)
org_id: OrganizationId
app_id: ApplicationId
app_uid: Option<ApplicationUid>
endpoint_id: EndpointId
msg_id: MessageId
msg_event_id: Option<MessageUid>
event_type: EventTypeName,
attempt_count: u16
status: MessageStatus
And the inner http_attempt also has:
http.response.status_code: i16Here is an example of how it looks like in an observability dashboard:
Additional attributes
You have the flexibility to add your own custom attributes to spans at either the app level or per event.
Application attributes
You can add additional otel attributes per app by adding key-value pairs to an application’s
metadata, prefixing the key with otel.. Example:
{
  "metadata": { "otel.custom-app-key-1": "custom-app-value-1" }
}
The param custom-app-key-1=custom-app-value-1 will be added to your spans.
Event attributes
You can add additional per-event attributes to your spans by passing custom key-value pairs in transformationsParams.otel
when calling the Create Message endpoint. Example:
{
  "payload": { "abc": "123" },
  "eventType": "my-event",
  "transformationsParams": {
    "otel": {
      "custom-key-1": "custom-value-1",
      "custom-key-2": "custom-value-2"
    }
  }
}
Configuring OpenTelemetry in the Dashboard
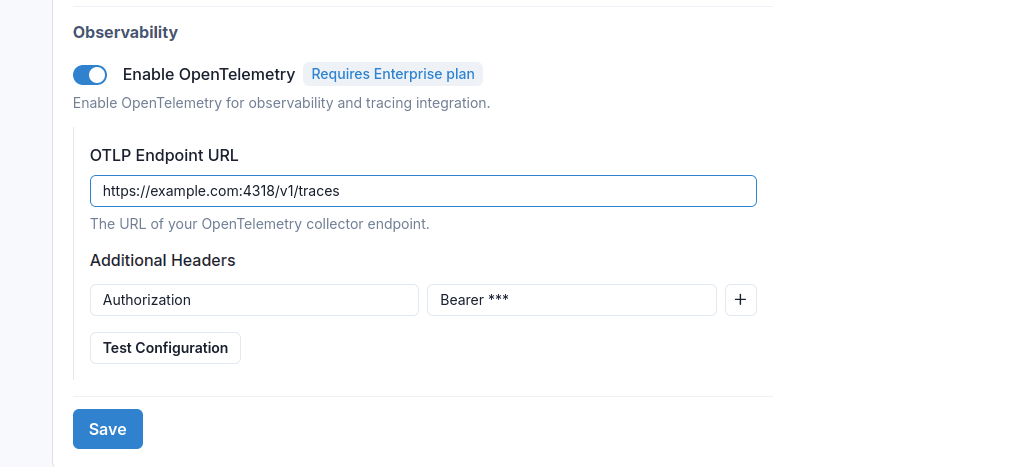
Configure OpenTelemetry settings in the Observability section of Dashboard settings. Once you’ve input the URL and optional headers, you can test functionality directly in the browser.
How to use it
The raw spans sent by Svix can be used in a variety of ways:
- Deriving graphs and metrics for your observability dashboards.
- Alerting for when specific customers fail over a certain threshold or their latency increases.
- Storing raw delivery logs for compliance reasons.
- Much more…
Notes on Integrating with Specific Observability Platforms
Most major APM/Observability platforms support OpenTelemetry ingestion with minimal configuration. Depending on the specific tool, you use, you may need to add specific headers in order for ingestion to work correctly.
Datadog
Datadog now supports tracing integration via OpenTelemetry natively. In order to set this up, you’ll need to know which Datadog site you use and your API key.
- Datadog’s OpenTelemetry URLs are specified as
https://otlp.{SITE}/v1/traces, e.g.,https://otlp.datadoghq.com/v1/tracesfor theUS1site. dd-api-keyheader must be included and set to a valid API key.
See Datadog OTLP Intake documentation for more details.
Coralogix
Coralogix OpenTelemetry integration generally works by adding the following custom headers to your OpenTelemetry configuration:
CX-Application-Name(Should be set to the environment name that produces the data)CX-Subsystem-Name(Should be set to the name of the service that produces the data)
See Coralogix OpenTelemetry documentation for further details.
New Relic
New Relic also offers support for consuming OpenTelemetry Data, but you will need to add the following custom header to your configuration:
api-key(Must be set to your license key)
See New Relic OpenTelemetry documentation for further details.
For additional instructions on how to integrate your specific observability platform with OpenTelemetry, please refer to your specific provider’s documentation or contact Svix support .
Video: Integrating with Grafana Cloud
This video shows how you can quickly integrate Svix OpenTelemetry exports with Grafana Cloud.